Better print debugging with Xcode breakpoints
Table of Contents
Print Debugging
The most common debugging technique that we all know is Print debugging. A print method is one of the first methods that I know when I jump into a new language, console.log, println, echo, puts, and for iOS, print and NSLog. It can help determine the cause of an error by track the flow and state of data at certain points of a program.
Pros
The strongest point of print debugging is its ease of use—no need to learn anything. Just puts print wherever you want to track, and that's it.
Cons
One of a drawback is you need to do a lot of cleans up after the test. Print debugging is it mean to be temporary and usually removed when the bug is solved. Failing to do so might slow-down the run-time. You would forget to remove it from time to time, and you might come up with a solution like removing print on release configuration.
An example of a way to remove print in release configuration.
func print(_ items: Any...) {
    #if DEBUG
        Swift.print(items[0])
    #endif
}
But hacking print like that is just sweeping unnecessary code under the carpet. It still sits there and pollutes your codebase.
Another problem with debugging with print is that you need to rebuild the app if you want to add a new printing point, which is quite a pain if your project takes a long time to compile.
You can easily support sarunw.com by checking out this sponsor.
Offline Transcription: Fast, privacy-focus way to transcribe audio, video, and podcast files. No data leaves your Mac.
A better way with breakpoint
Today I'm going to show you what I think is a better replacement of print debugging, a breakpoint. It is quite obvious that using a debugging tool would look cleaner and less housekeeping. But the main reason you use print is the ease of use. Let's see how easy it is compared to our beloved print.
Print a string
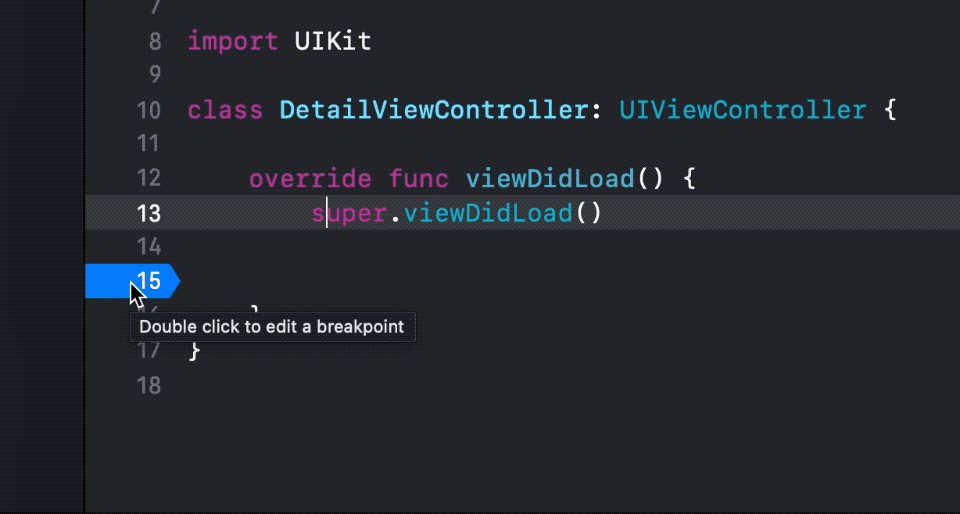
To simulate print debugging with breakpoint:
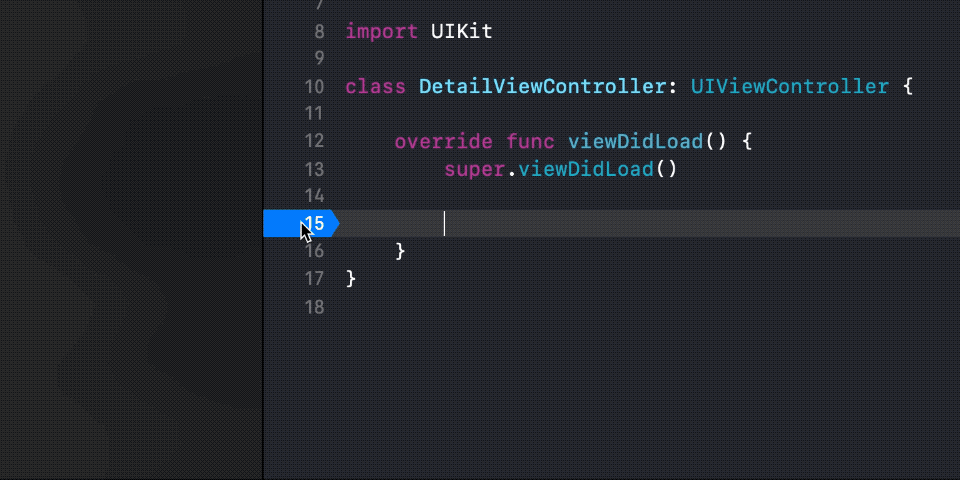
- Double-click on a line number where you would typically put your
printmethod.
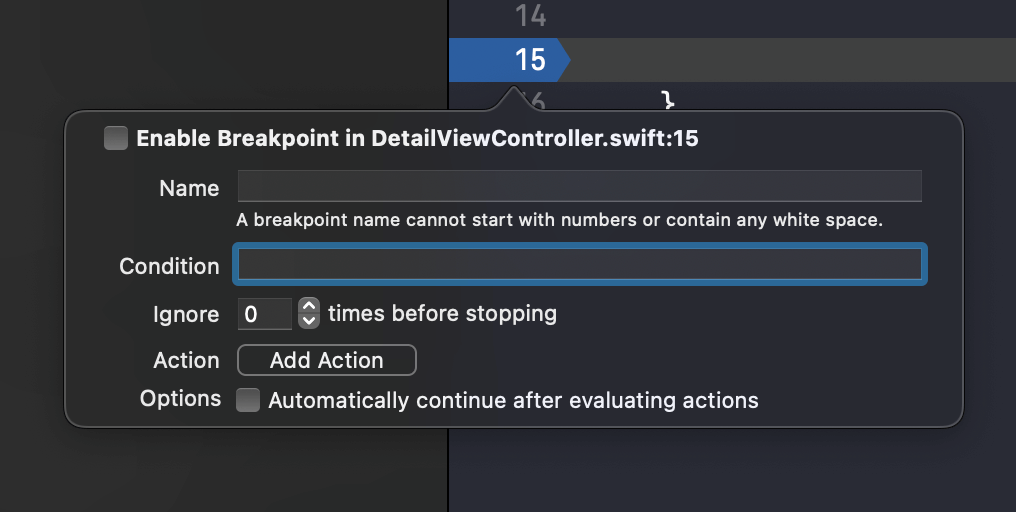
- You will see a breakpoint editor window like this.
- Click the Add Action button and select Log Message. Put any string that you want to print out in a debug console in a text field.
- Check Automatically continue after evaluating actions. This will prevent the debugger from stopping at this breakpoint.
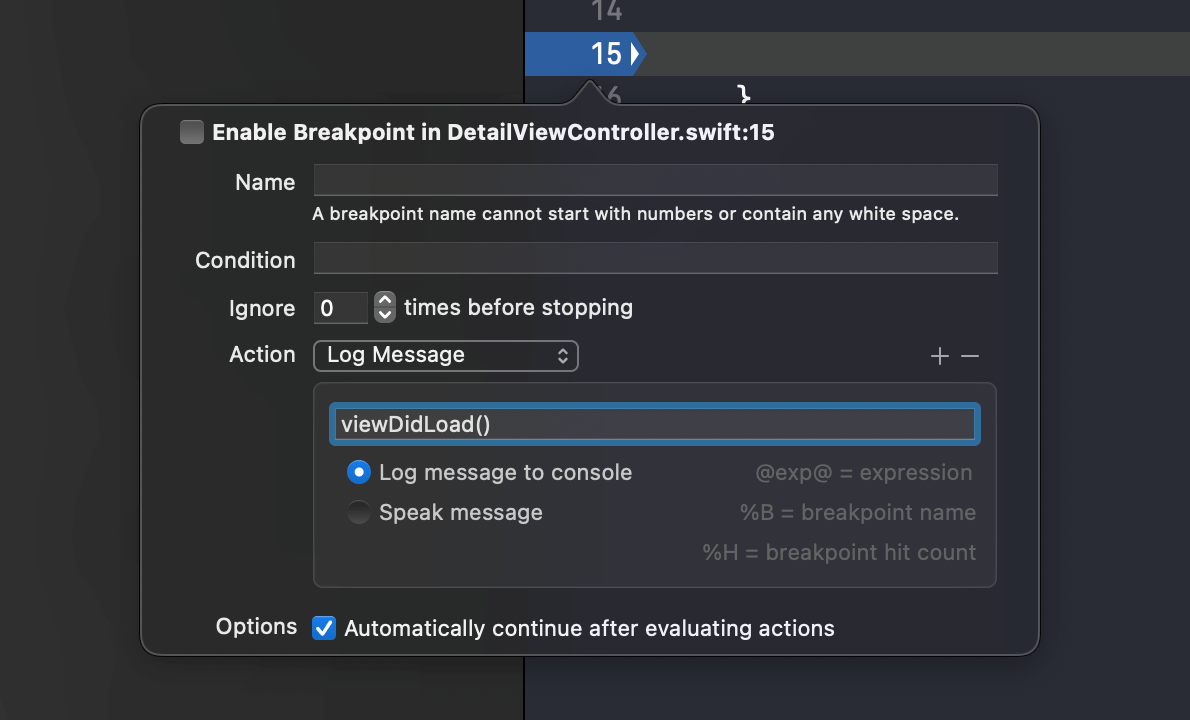
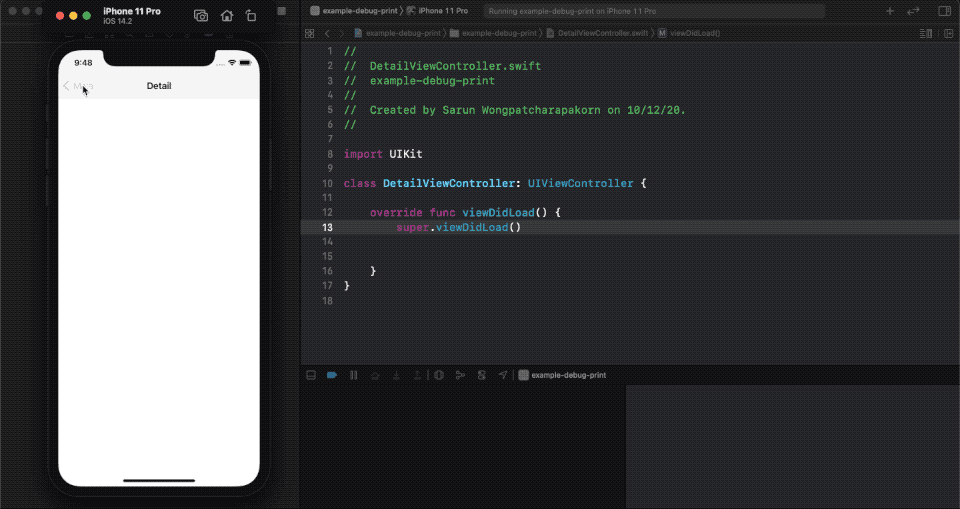
When the breakpoint's line is reached, you will see the log message print in the console. In this case viewDidLoad().
As you can see, the steps required to do this is very minimal. I think it can compete with the easiness of print.
Print a variable
To print a variable:
- Double-click on a line number where you would normally put your
printmethod.
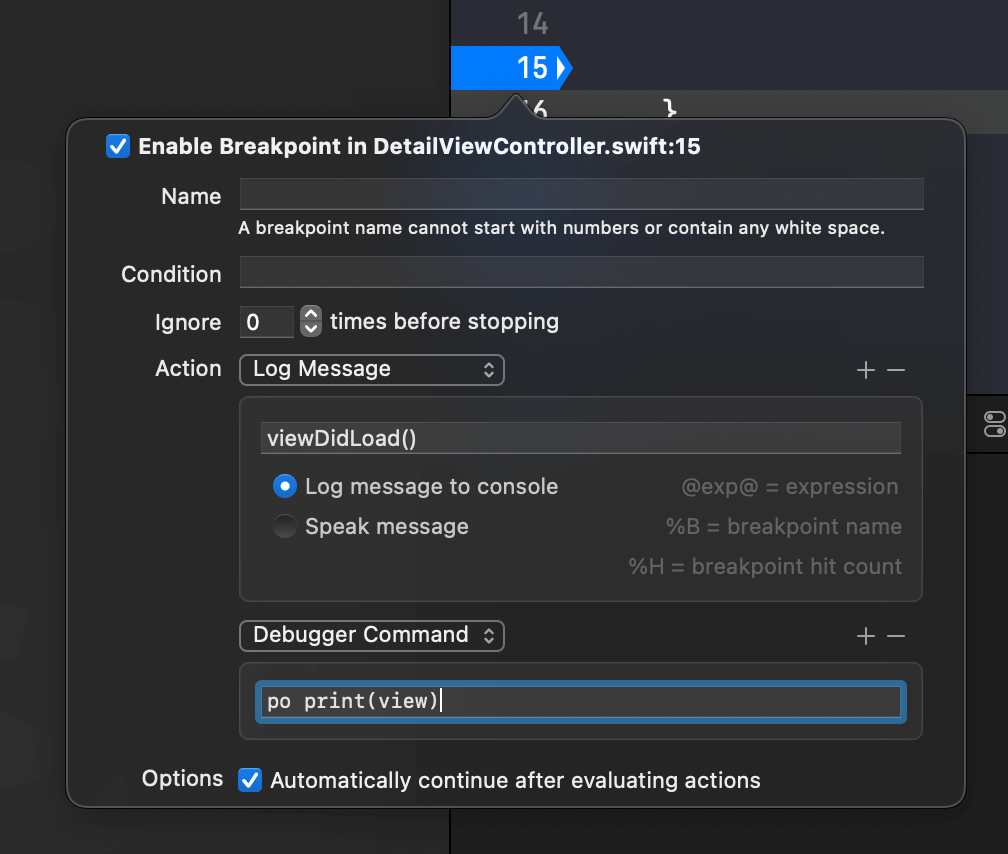
- You will see a breakpoint editor window like this.
-
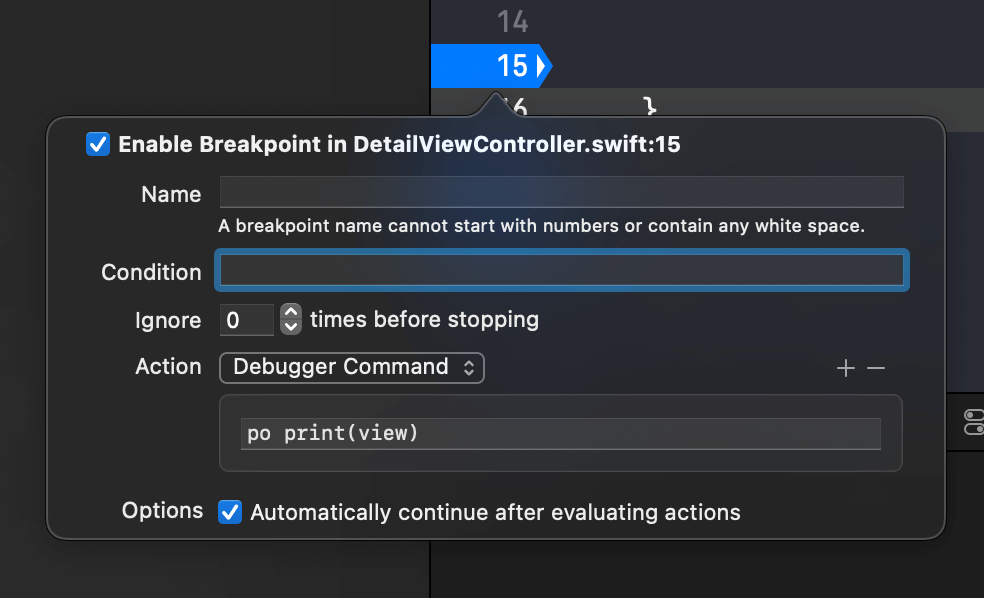
Click the Add Action button and select Debugger Command. Put any
printcommand in a debug console in a text field. Make sure you prefix it withpo, e.g.,po print(view). -
Check Automatically continue after evaluating actions. This will prevent the debugger from stopping at this breakpoint.
Combine multiple actions
The process of print a variable and string are quite the same. You can even combine multiple actions by clicking a plus icon (+) next to the Action selector to add a new action.
Pros
As you can see, using a breakpoint can replace what print can do with a lot more benefits.
- No
printcommand all over the place, so no clean up afterward. You just disable a breakpoint or remove it after finished.
- You can quickly move it around.
- The best part is you don't need to recompile the app when adding/edit/move/delete your breakpoints.
You can easily support sarunw.com by checking out this sponsor.
Offline Transcription: Fast, privacy-focus way to transcribe audio, video, and podcast files. No data leaves your Mac.
Related Resources
Read more article about Debugging or see all available topic
Enjoy the read?
If you enjoy this article, you can subscribe to the weekly newsletter.
Every Friday, you'll get a quick recap of all articles and tips posted on this site. No strings attached. Unsubscribe anytime.
Feel free to follow me on Twitter and ask your questions related to this post. Thanks for reading and see you next time.
If you enjoy my writing, please check out my Patreon https://www.patreon.com/sarunw and become my supporter. Sharing the article is also greatly appreciated.
Become a patron Buy me a coffee Tweet ShareReduce boilerplate code with an automatic synthesis of Equatable and Hashable conformance
Equatable and Hashable are two essential protocols in the Swift world. Let's learn an old Swift feature that you might forget.
What is @escaping in Swift closures
Learn the meaning of @escaping so you know what to do when you see it or when you need to write one.