How to generate code coverage reports in Xcode
Table of Contents
Xcode has a feature to generate code coverage since version 7. Too bad it isn't enabled by default. That's why you might not be aware of its existence. This article will show you how easy it is to enable code coverage in your project and highlight what you get after enabling it.
Here is how it looks.

How to enable code coverage
You enable code coverage in the scheme's Test action.
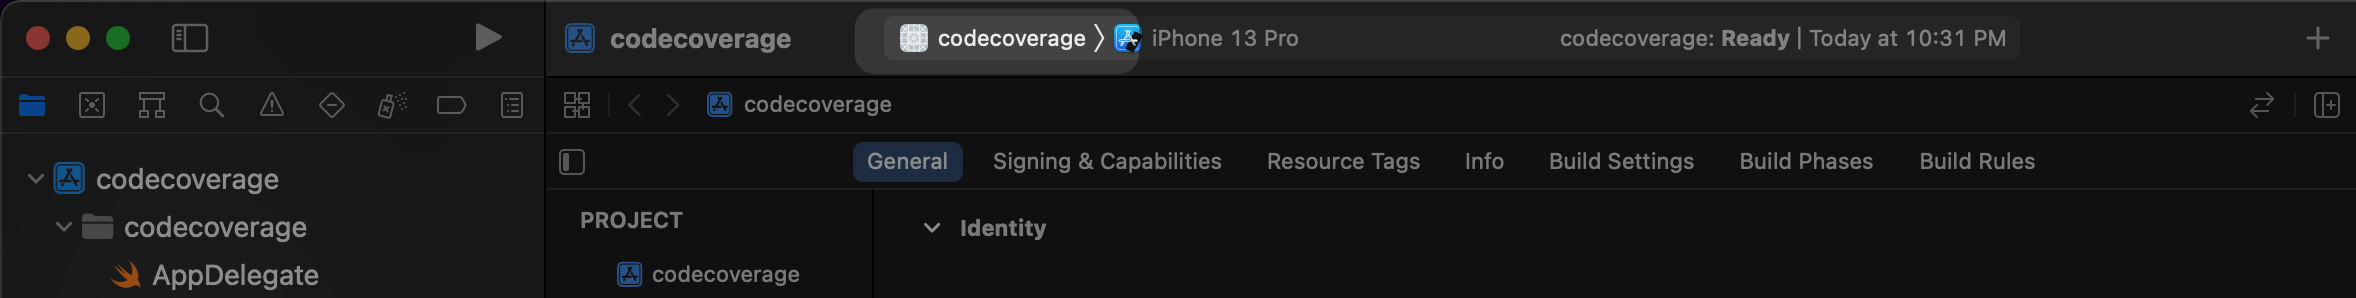
- Open the scheme editor window by tapping the current scheme on the toolbar.
![]()
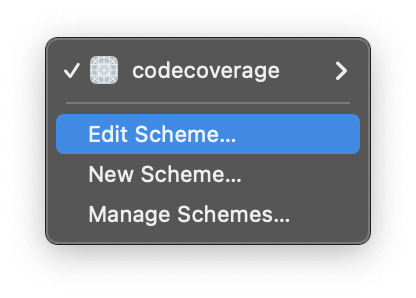
- Then select "Edit Scheme..." from the scheme editor menu.
![]()
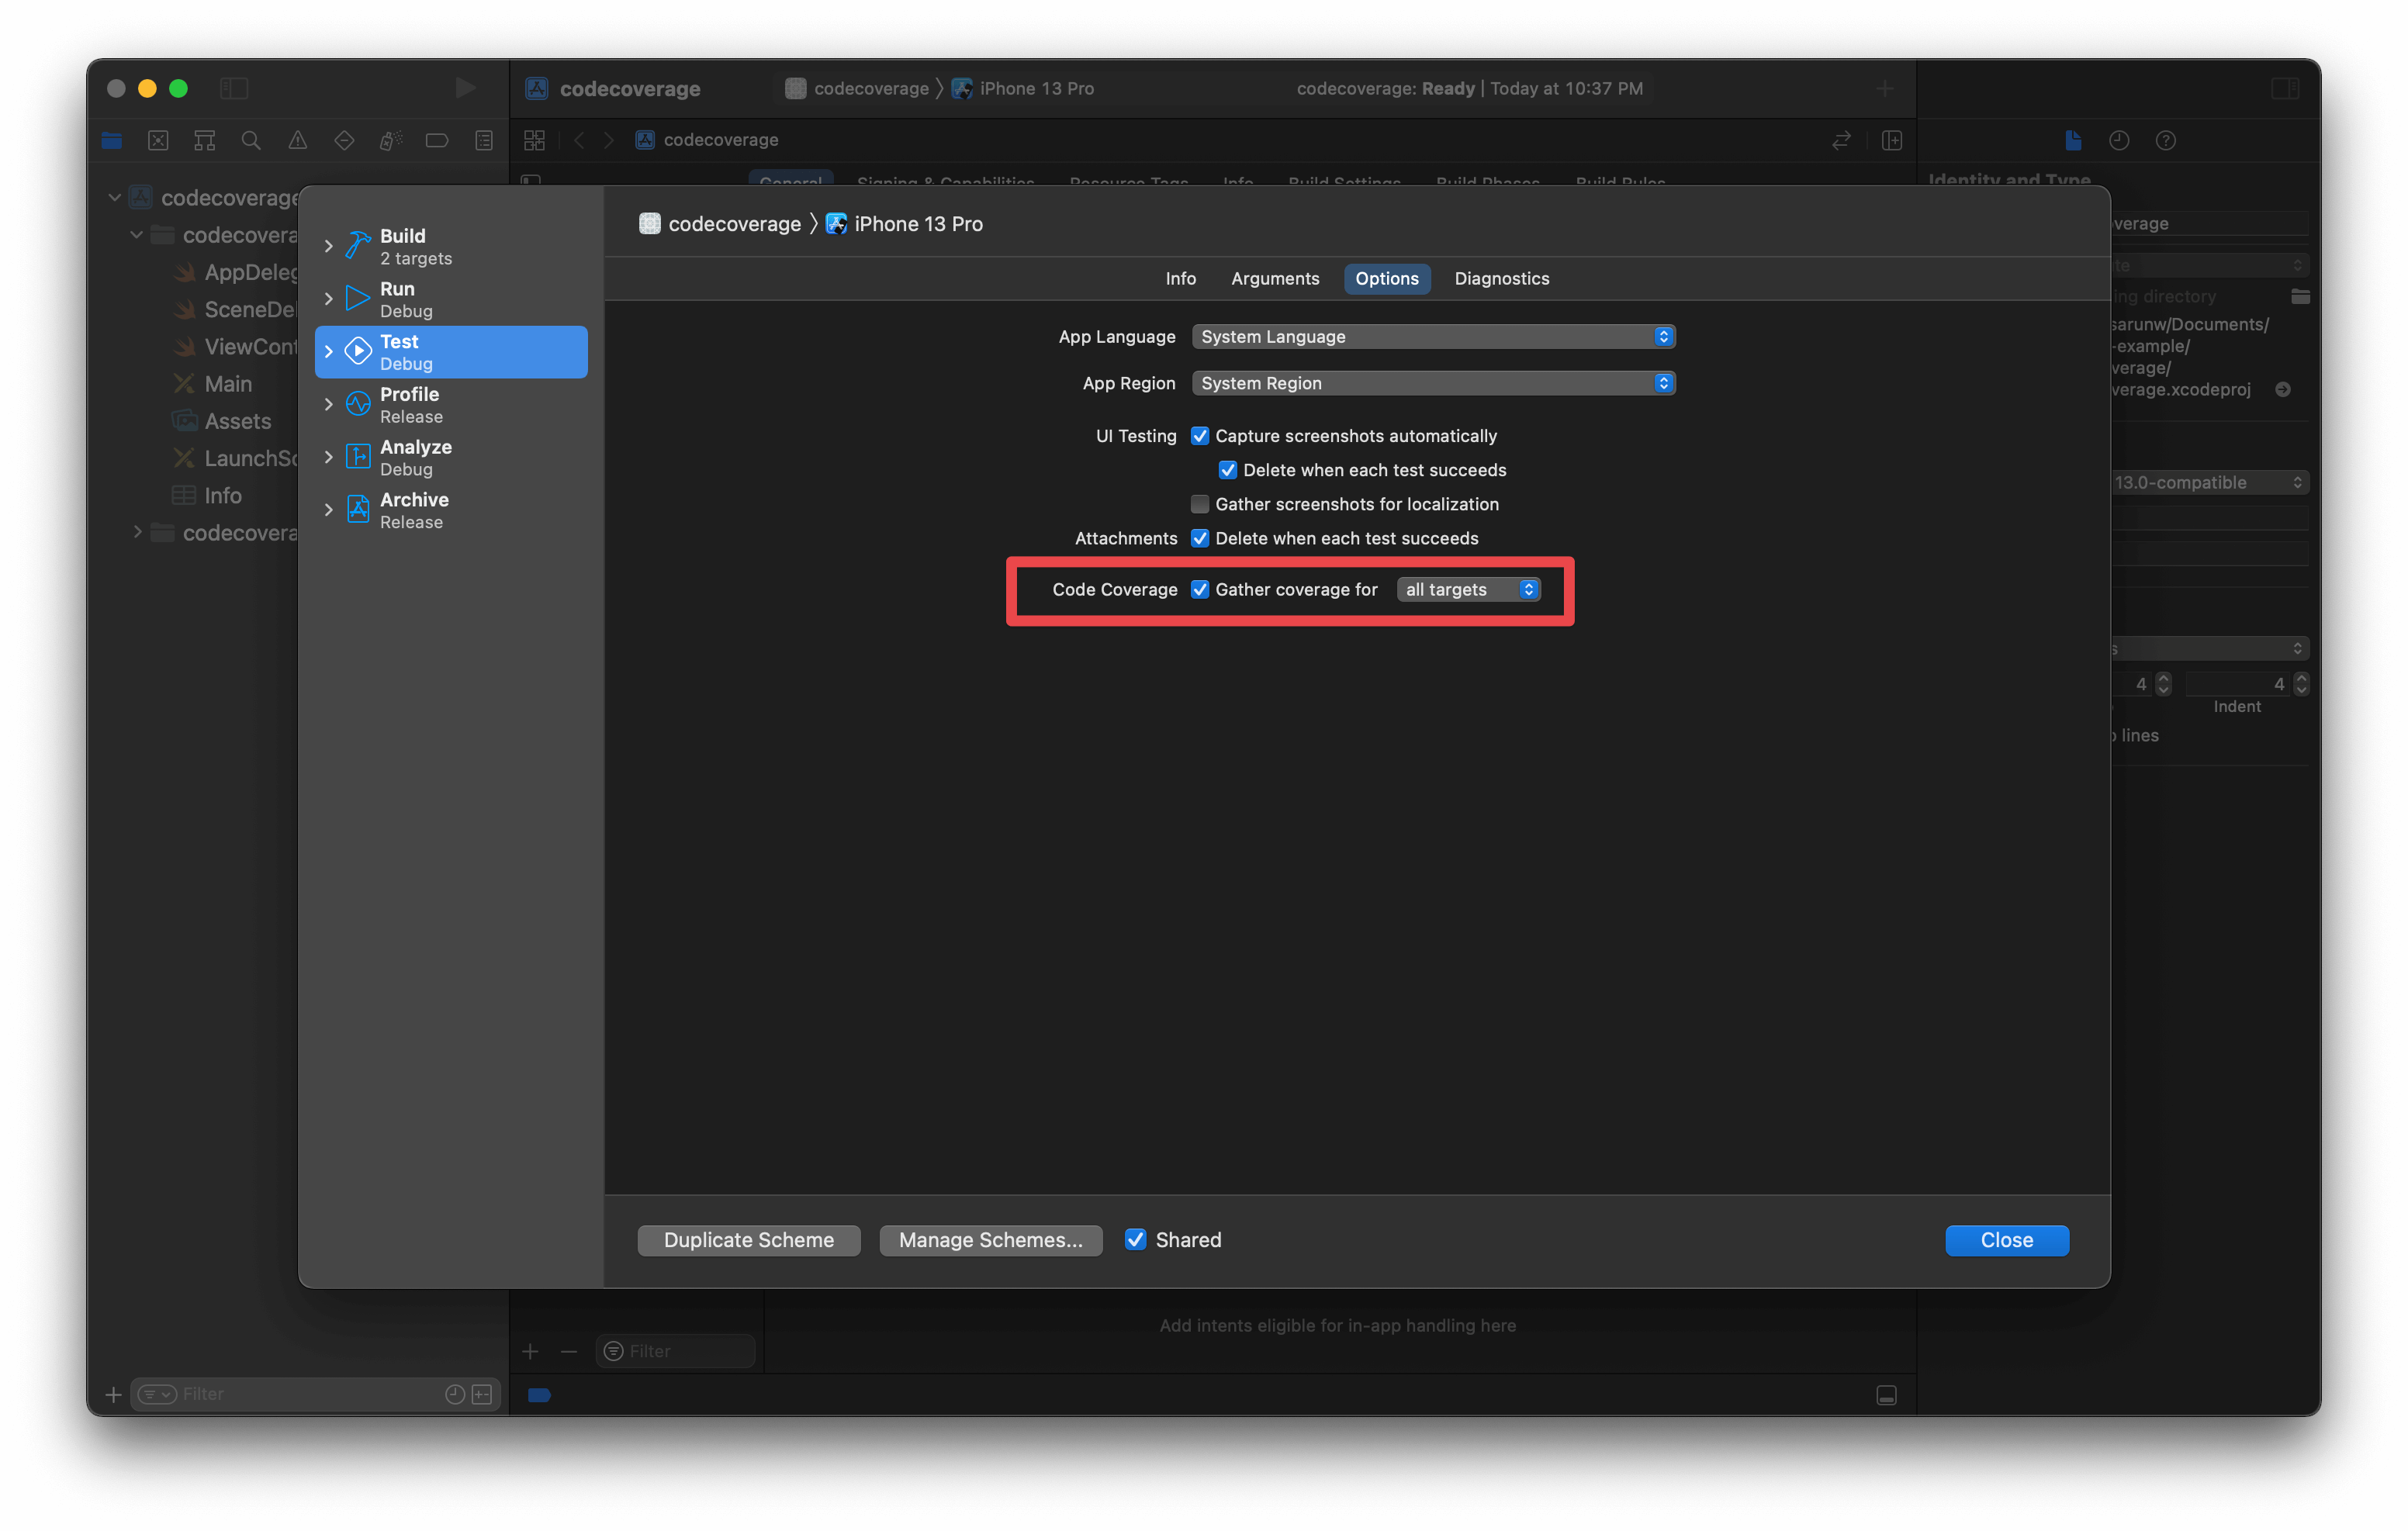
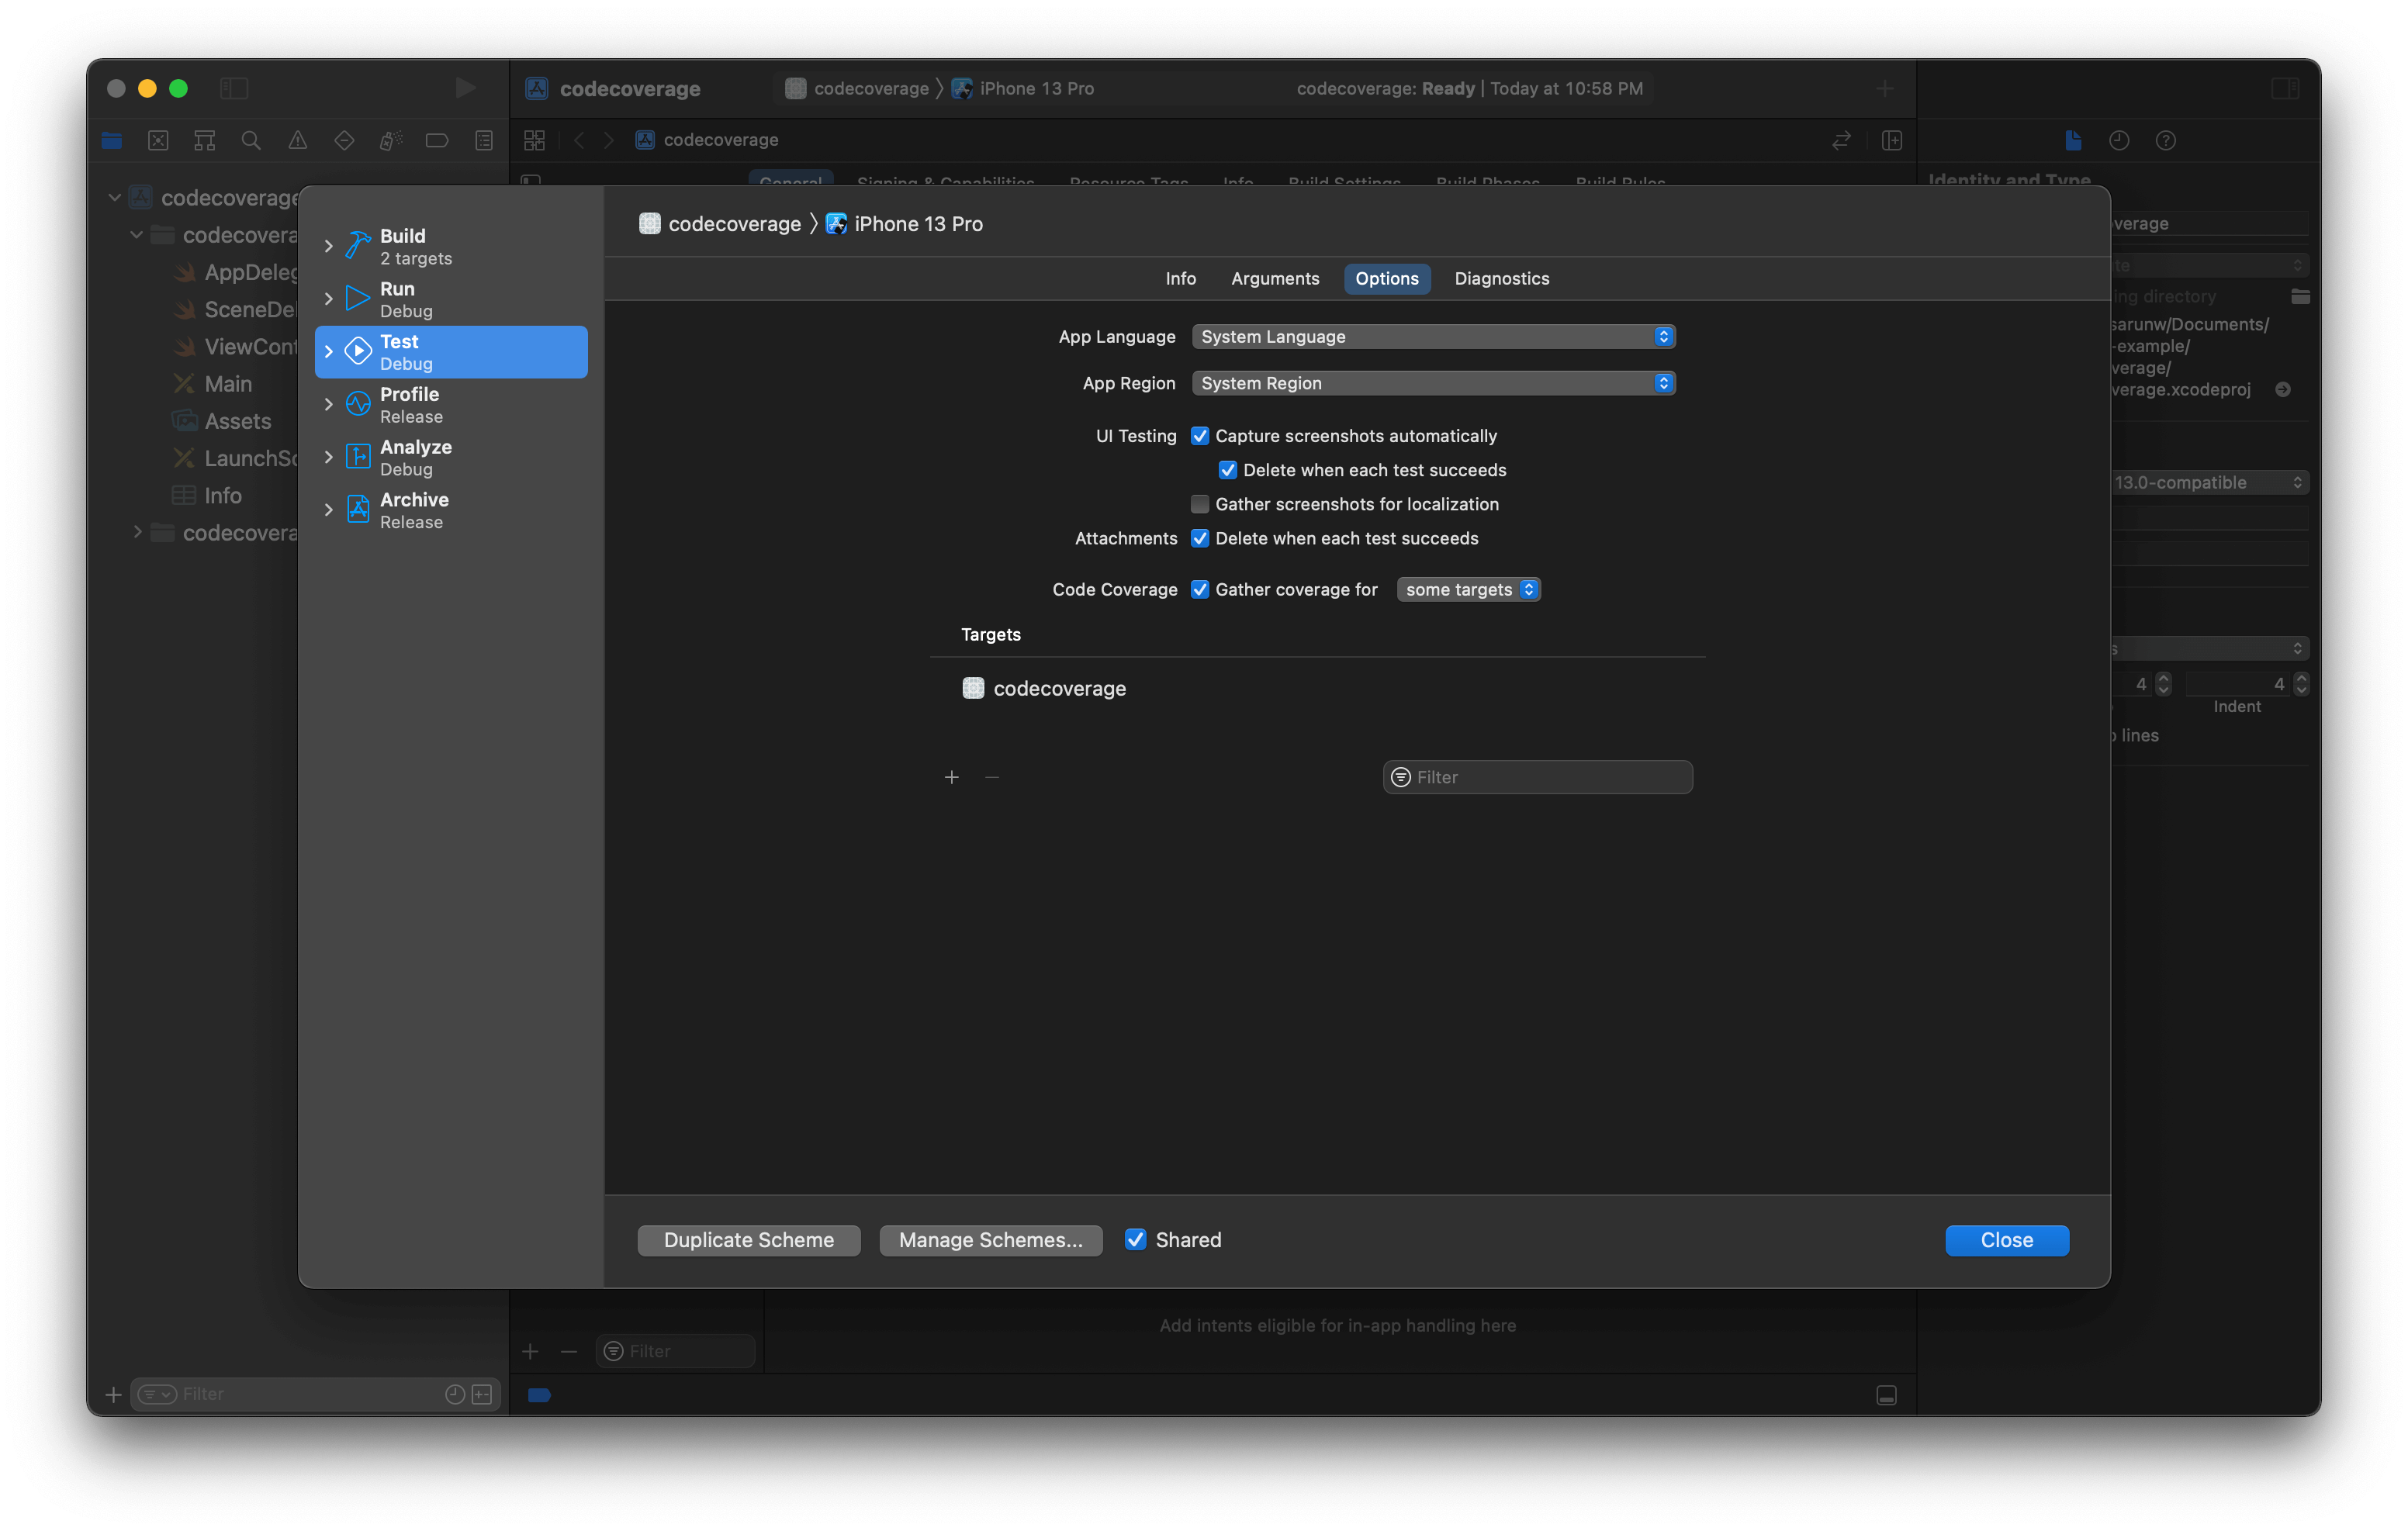
- Select the Test action from the left pane.
- Enable the Code Coverage checkbox to gather coverage data.
![]()
That's all you need to do to enable the code coverage feature.
Generate reports for some targets
If you have third-party dependencies, selecting the all targets option will also generate reports for third-party libraries, which is probably not what you want.
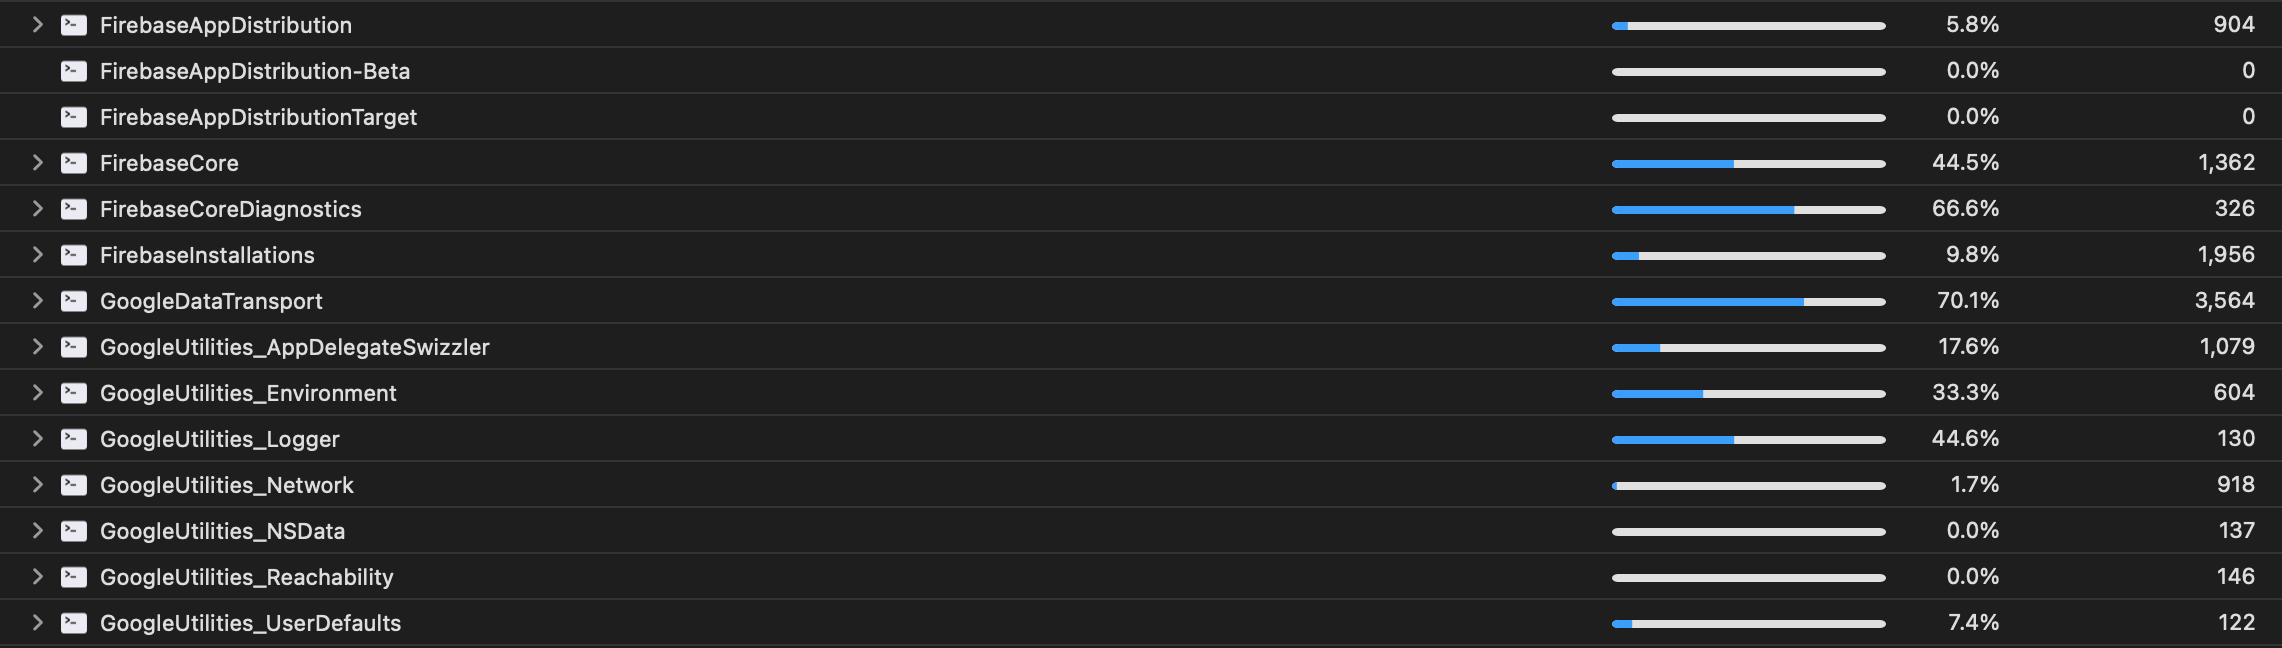
To generate the report only for your code, change the code coverage option from all targets to some targets. Then click the plus button (+) and select your app target or module to generate the reports.
You can easily support sarunw.com by checking out this sponsor.
AI Grammar: Correct grammar, spell check, check punctuation, and parphrase.
Where is the code coverage report
After you enable code coverage, it will affect two areas in Xcode.
Reports navigator
Code coverage report will generate after you finish running your tests. You can find it under the Reports navigator. (View menu > Navigators > Reports or ⌘ - command + 9).
After you open it, under the latest Test report, you should find a Coverage report, click on that, and it will contain the coverage information of that test run.
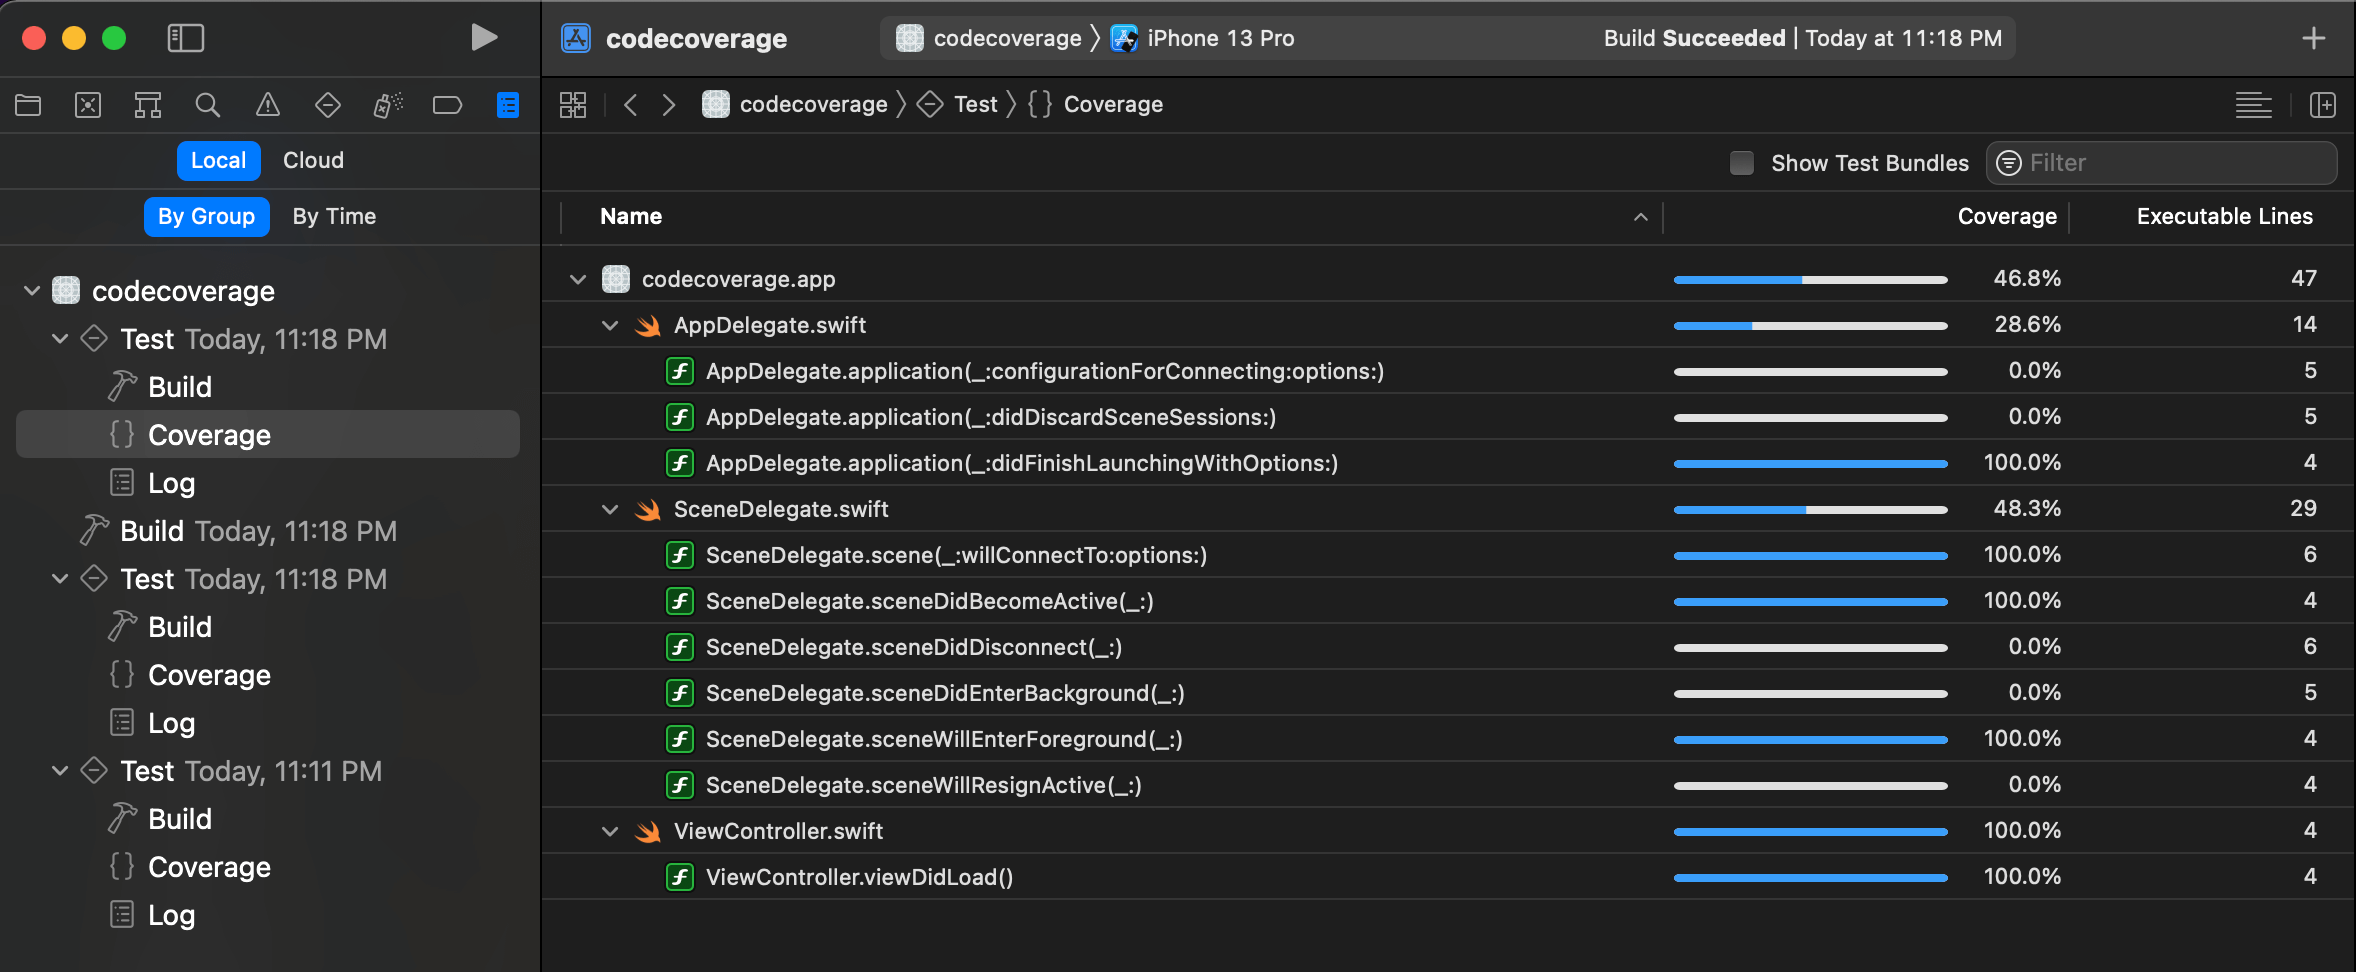
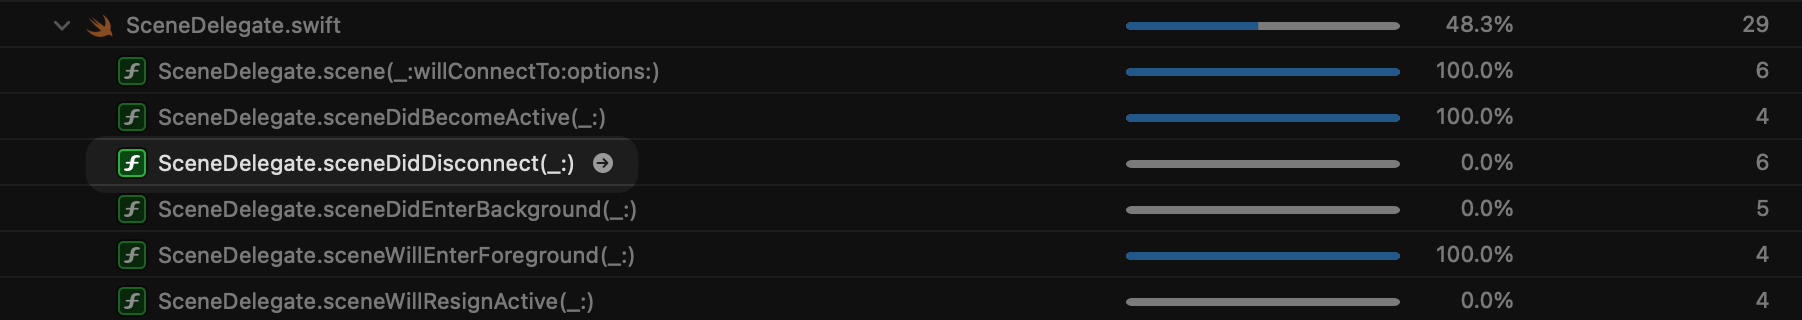
You can jump to the source code of any file or method by hovering on that file or method and clicking an arrow icon.
Source editor
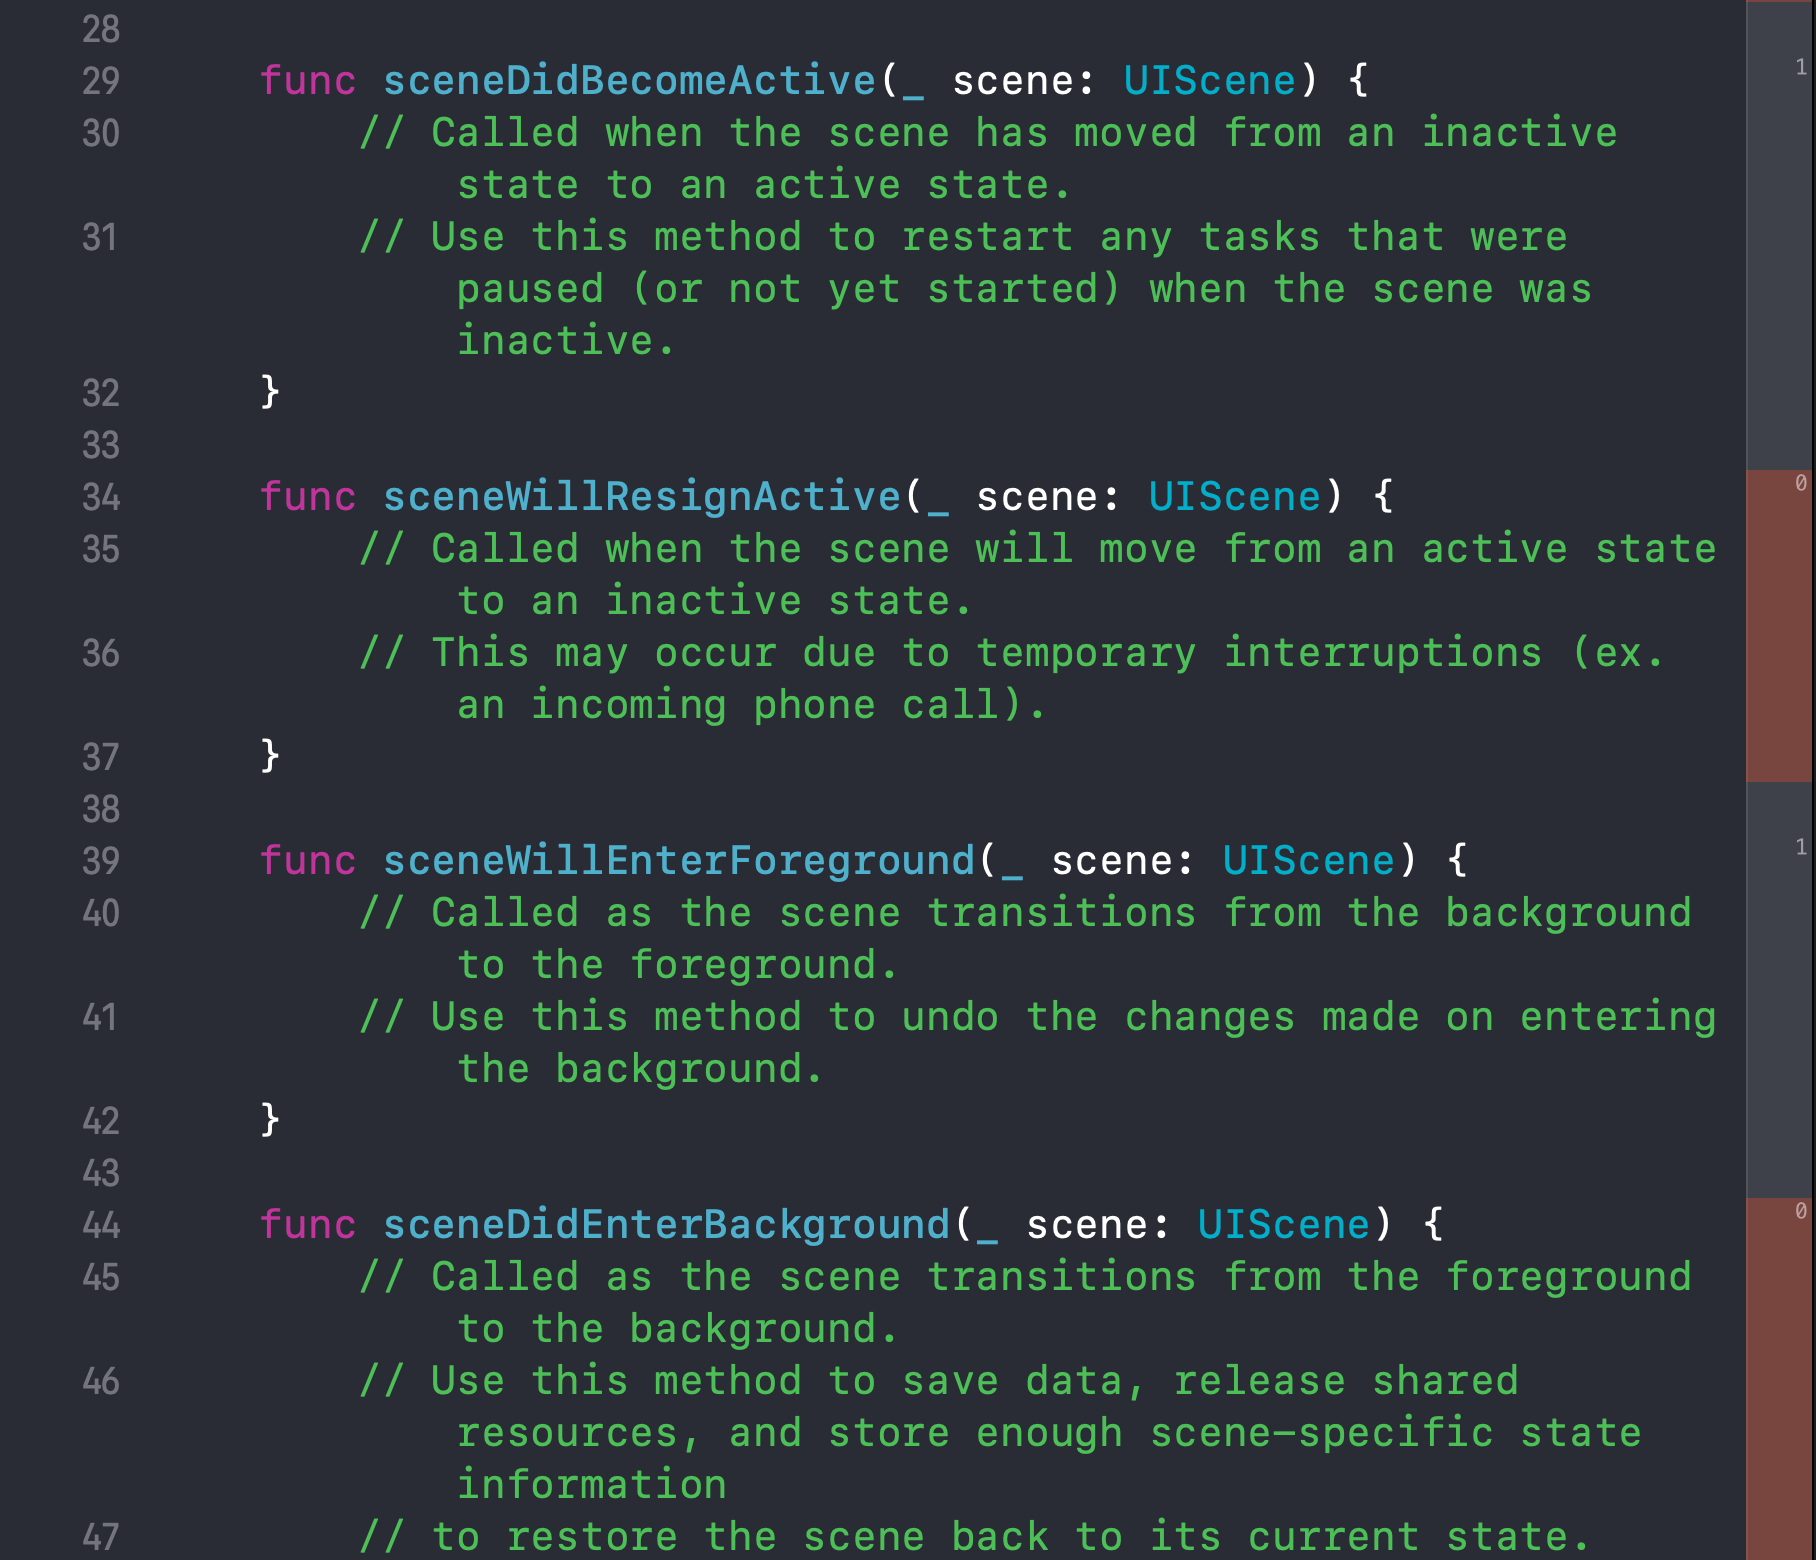
Another area that gets affected when enabling a code coverage feature is in the source editor. It will show coverage annotation on the right side of the editor.
Coverage annotation provides you with two pieces of information.
-
It shows a number indicating the number of times a particular part of the code was hit during the test. The following example show that
sceneDidBecomeActive(_ scene: UIScene)andsceneWillEnterForeground(_ scene: UIScene)are run once.
![]()
-
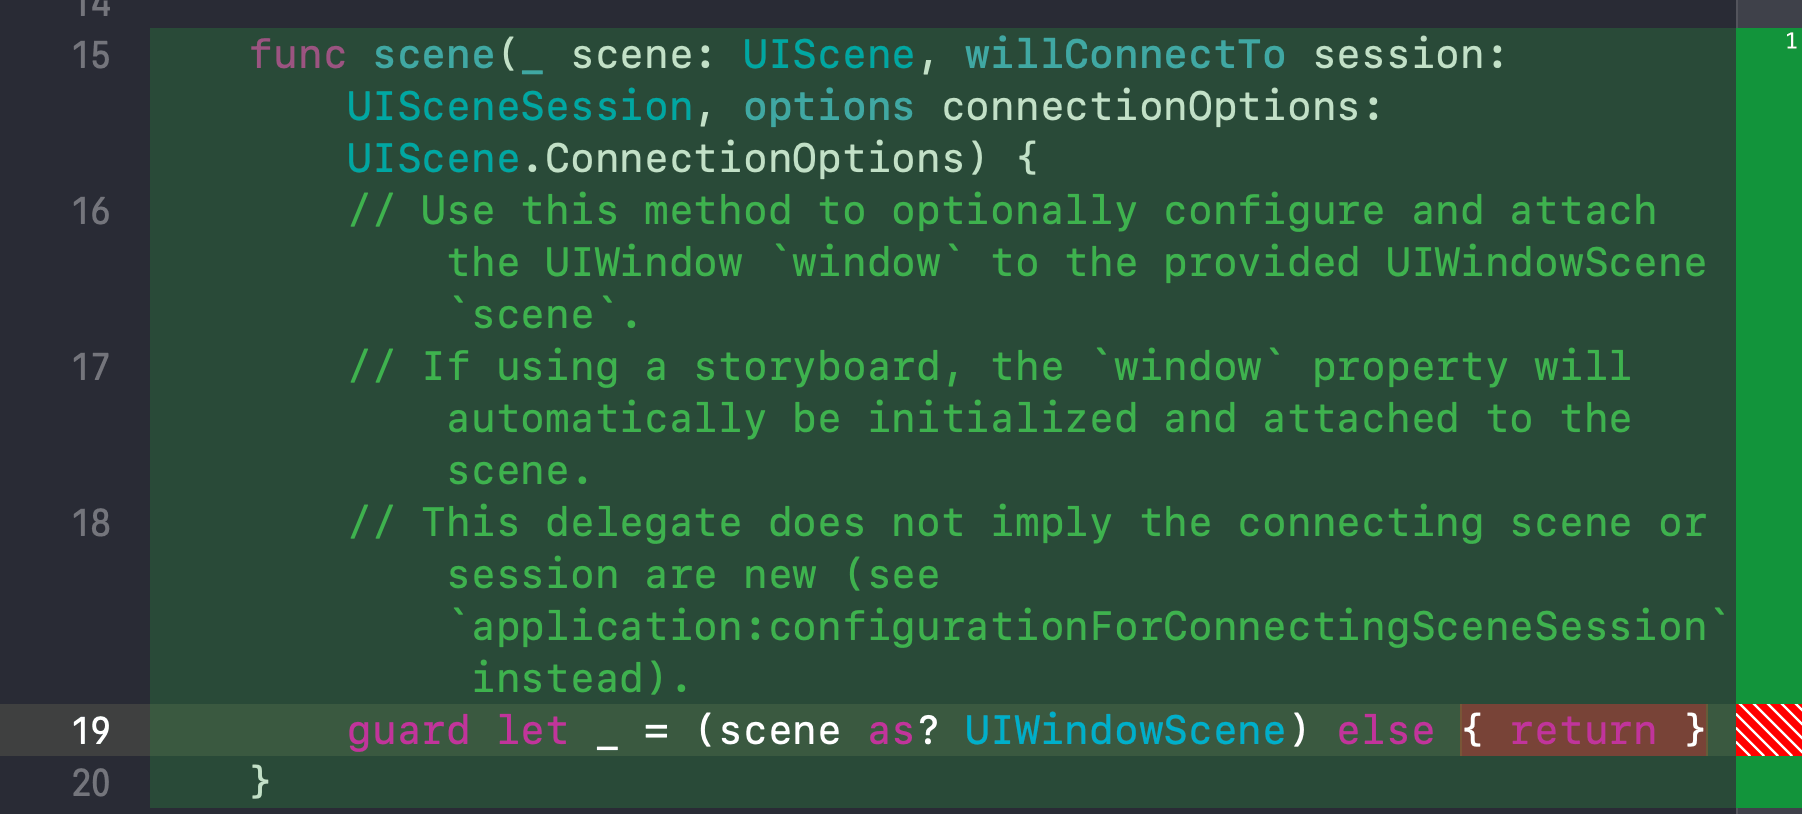
It shows a red color if a test didn't hit a part of the code at all. You can hover your mouse over the right area to highlight the code in green and red for more visualization. The following example show that
scene(_ scene: UIScene, willConnectTo session: UISceneSession, options connectionOptions: UIScene.ConnectionOptions)is executed, but theelsecase is not.
![]()
Note
In my opinion, one reason that Apple doesn't enable code coverage by default is that it isn't directly related to code quality. Enable it also comes with a performance penalty, so it is better to make it an opt-in and have an option open for those who see the benefit.
Here are excerpts from Apple documentation about the performance penalty.
Code coverage data collection incurs a performance penalty. Whether the penalty is significant or not, it should affect execution of the code in a linear fashion, so performance results remain comparable from test run to test run when it is enabled. However, you should consider whether to have code coverage enabled when you are critically evaluating the performance of routines in your tests.
You can easily support sarunw.com by checking out this sponsor.
AI Grammar: Correct grammar, spell check, check punctuation, and parphrase.
Conclusion
For me, code coverage is a tool that answers the following questions.
- What code is actually being run when you run your tests?
- What parts of your code are not being tested?
Code coverage is a great tool to ensure every part of your code gets executed. It gives a rough overview of how much is left to be done. But don't confuse that with the quality of your tests.
Code coverage only tells you how much code has been executed. It means nothing more than that.
You can write tests with 100% code coverage that test nothing. Make sure you understand that before enabling the feature. Don't treat code coverage as proof of the quality of your tests.
Read more article about Xcode, Testing, or see all available topic
Enjoy the read?
If you enjoy this article, you can subscribe to the weekly newsletter.
Every Friday, you'll get a quick recap of all articles and tips posted on this site. No strings attached. Unsubscribe anytime.
Feel free to follow me on Twitter and ask your questions related to this post. Thanks for reading and see you next time.
If you enjoy my writing, please check out my Patreon https://www.patreon.com/sarunw and become my supporter. Sharing the article is also greatly appreciated.
Become a patron Buy me a coffee Tweet ShareCodable synthesis for enums with associated values in Swift 5.5
Swift 5.5 extends the support for the automatic synthesis to enums with associated values. Learn what can be expected from the synthesis code.