Easy way to detect a retain cycle in a view controller
Table of Contents
A view controller is one component where memory leak usually takes place since it the one that glues many pieces of code together. One mistake, and you end up leaking.
Apple offers a sophisticated tool for debugging memory leaks like Instrument, but I have to admit that not what I use. When I suspect that there is a leak in my view controller, what I use is put a print in deinit method.
deinit {
    print("deinit \(self)")
}
If there is a leak, deinit won't get called, and nothing will be print. Even it's not elegant, but it serves me very well for years.
A better way
Recently I come across a really nice tip from Cédric Luthi (@0xced).
He uses Symbolic Breakpoint to detect view controllers not being deallocated. The same concept as my print, but a lot cleaner. You don't populate your code with print this way.
- Go to Breakpoint Navigator (Menu View > Navigators > Show Breakpoint Navigator or ⌘ - command + 8).
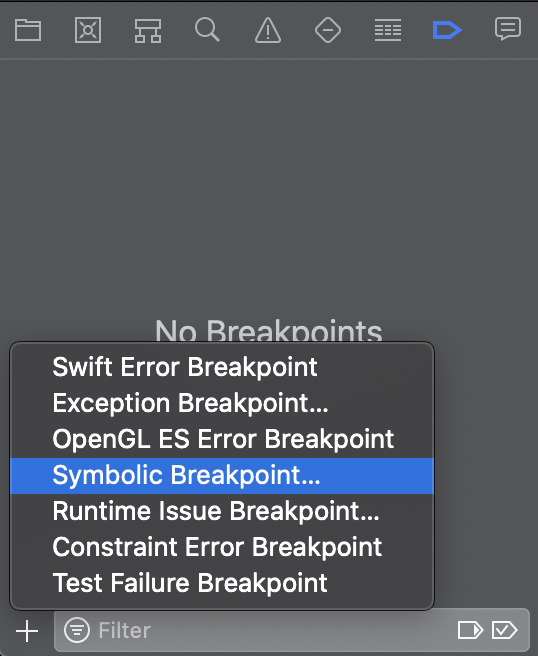
- Click + and select Symbolic Breakpoint... or Menu Debug > Breakpoints > Create Symbolic Breakpoint...
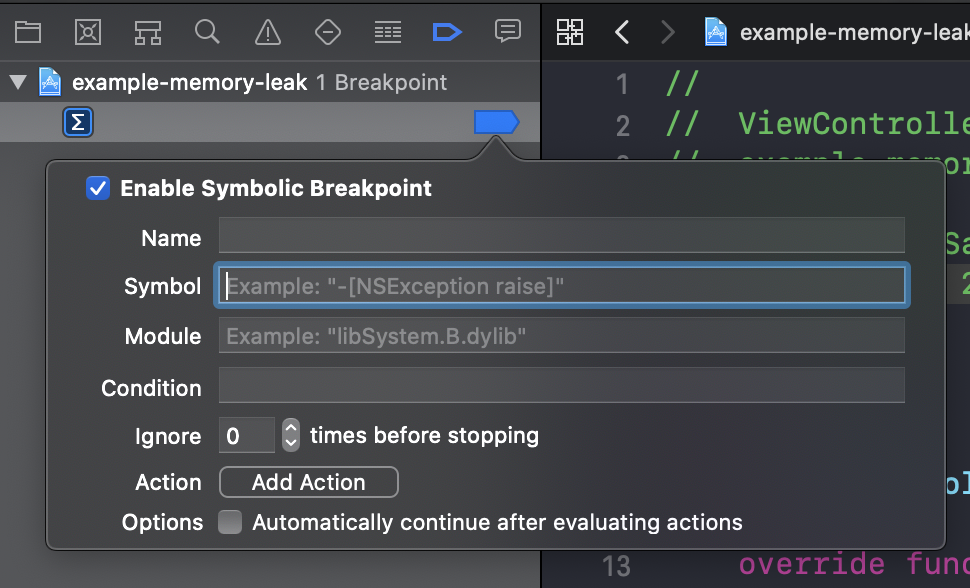
- Set
Symbolwith value-[UIViewController dealloc].

- Click Add Action button and set
Soundtopop(or any sound you like).

- Add another action by click + next to our sound action.
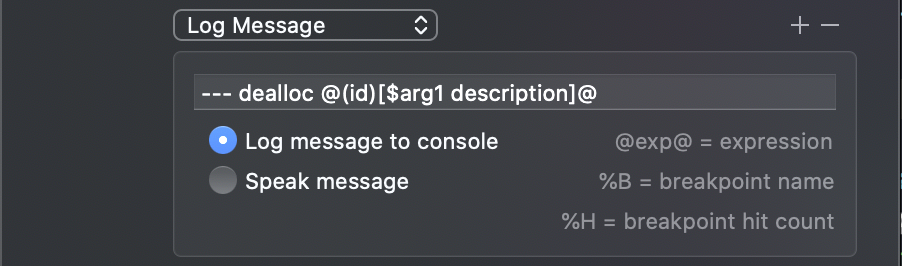
- Set an action to
Log Messageand set a message to whatever you want to print to the console when a view controller gets deallocated. In my case I set it to--- dealloc @(id)[$arg1 description]@.
- Check Automatically continue after evaluating actions option since we don't want a debugger to pause when a view controller gets deallocated.

You can easily support sarunw.com by checking out this sponsor.
AI Paraphrase:Are you tired of staring at your screen, struggling to rephrase sentences, or trying to find the perfect words for your text?
Detect a leak
With this breakpoint in place, whenever a view controller dismisses or pops out of a navigation stack, you will hear a popping sound and a log in debug console. That's mean everything is working as expected.
If you pop or dismiss a view controller and don't hear the popping sound, that's means there's a leak.
You can easily support sarunw.com by checking out this sponsor.
AI Paraphrase:Are you tired of staring at your screen, struggling to rephrase sentences, or trying to find the perfect words for your text?
Conclusion
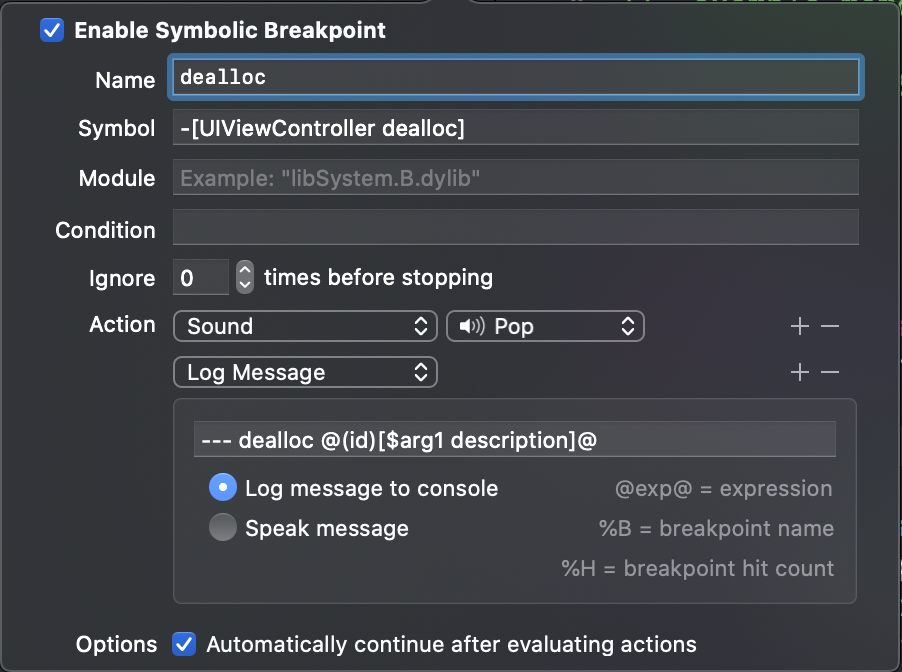
Here are the final Symbolic Breakpoint values.
| Field | Value |
|---|---|
Symbol |
-[UIViewController dealloc] |
Module |
Leave blank or UIKitCore |
Action: Sound |
pop or whatever sound you like |
Action: Log Message |
--- dealloc @(id)[$arg1 description]@ or what ever you want to print in debug console |
Options |
Check Automatically continue after evaluating actions |
Read more article about Xcode, Debugging, or see all available topic
Enjoy the read?
If you enjoy this article, you can subscribe to the weekly newsletter.
Every Friday, you'll get a quick recap of all articles and tips posted on this site. No strings attached. Unsubscribe anytime.
Feel free to follow me on Twitter and ask your questions related to this post. Thanks for reading and see you next time.
If you enjoy my writing, please check out my Patreon https://www.patreon.com/sarunw and become my supporter. Sharing the article is also greatly appreciated.
Become a patron Buy me a coffee Tweet ShareSleep sort: A sorting algorithm without compare
I can't tell it is a stupid or genius algorithm, but it sure got a beauty in it.